How many calories are in pasta?
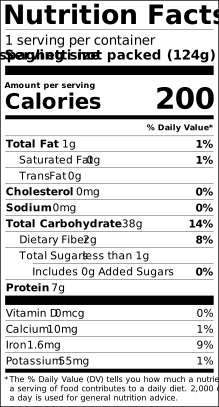
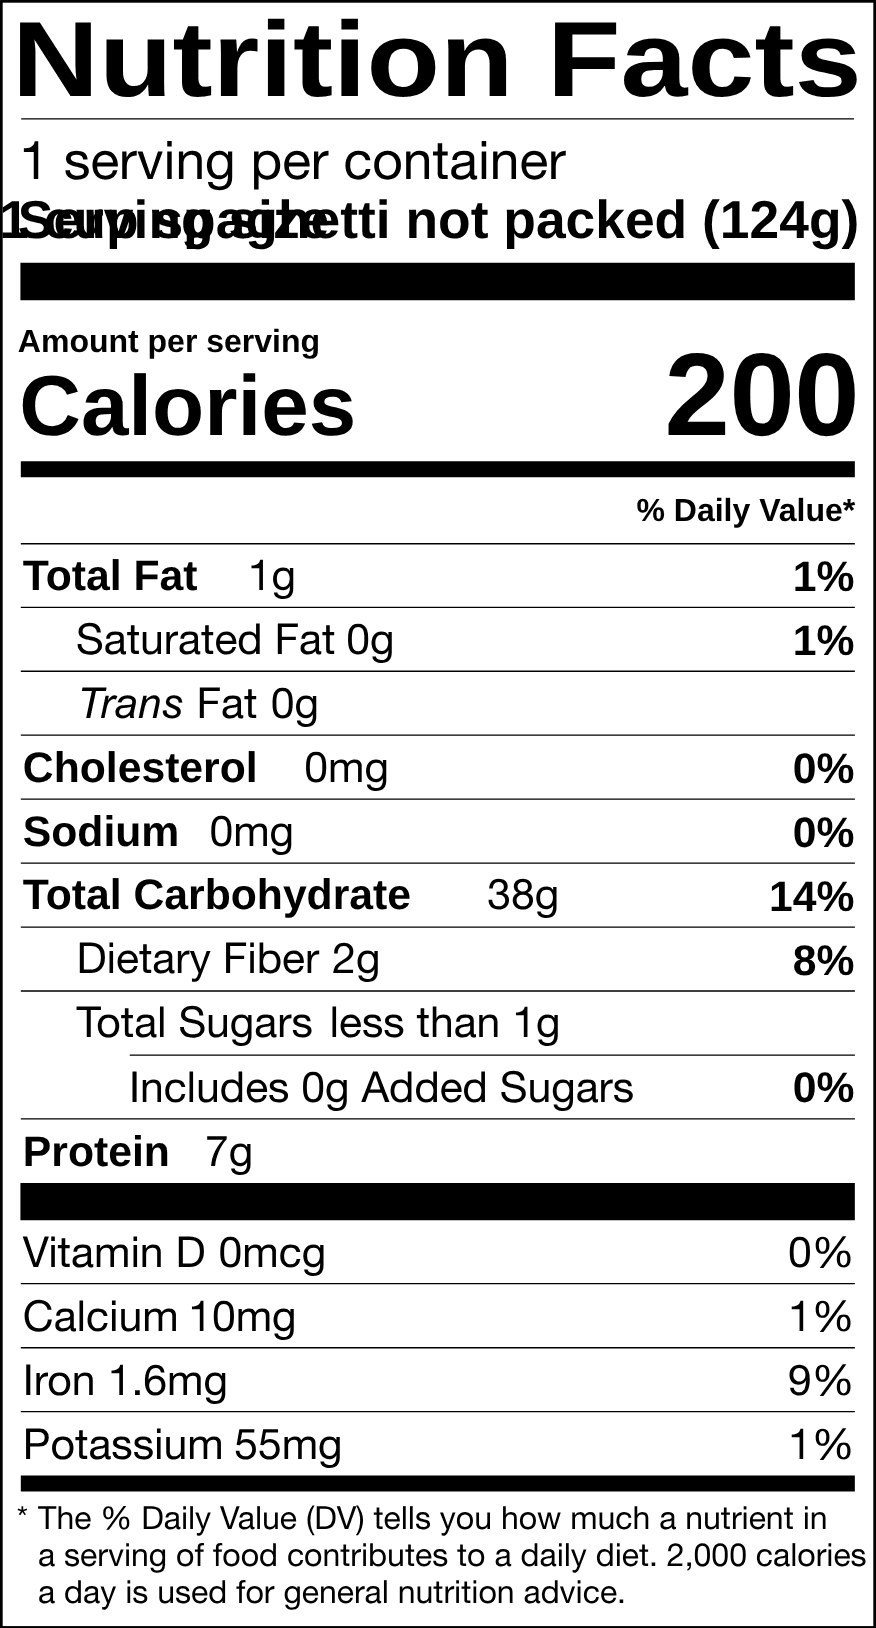
A cup of cooked spaghetti (124 g) has 196 calories. 100 g has 158 calories. On a Nutrition Facts label, calories are rounded to the nearest 5 or 10, so the panel above may show 200.
A cup of cooked spaghetti, loosely filled (124 g), has 196 calories, 38.3 g of carbohydrate and 7.2 g of protein. The values are USDA's for enriched pasta cooked in unsalted water, so they describe pasta as you eat it, not the dry pasta in the box.
FDA standard format. Values use the FDA rounding rules for the serving you pick. Nutrients USDA does not report for this food print as 0 on the panel and as "not reported" in the table.
Download this label: SVG · PNG Free to use as a reference. A label for a product you sell needs your full recipe and ingredient statement.
1 cup spaghetti not packed (124 g)
Opens the free label generator with this amount of pasta already added. Add the rest of your ingredients and the label updates as you go.
| Nutrient | Per serving | % DV* | Per 100 g |
|---|---|---|---|
| Calories and macronutrients | |||
| Calories | 196 | 158 | |
| Total fat | 1.2 g | 1% | 0.93 g |
| Saturated fat | 0.2 g | 1% | 0.18 g |
| Trans fat | 0 g | 0 g | |
| Monounsaturated fat | 0.2 g | 0.13 g | |
| Polyunsaturated fat | 0.4 g | 0.33 g | |
| Cholesterol | 0 mg | 0% | 0 mg |
| Sodium | 1.2 mg | 0% | 1 mg |
| Total carbohydrate | 38.3 g | 14% | 30.9 g |
| Dietary fiber | 2.2 g | 8% | 1.8 g |
| Total sugars | 0.7 g | 0.56 g | |
| Added sugars | 0 g | 0% | 0 g |
| Protein | 7.2 g | 5.8 g | |
| Vitamins | |||
| Vitamin D | 0 mcg | 0% | 0 mcg |
| Vitamin A | 0 mcg | 0% | 0 mcg |
| Vitamin C | 0 mg | 0% | 0 mg |
| Vitamin E | 0.07 mg | 0% | 0.06 mg |
| Vitamin K | 0 mcg | 0% | 0 mcg |
| Thiamin (B1) | 0.34 mg | 28% | 0.27 mg |
| Riboflavin (B2) | 0.17 mg | 13% | 0.14 mg |
| Niacin (B3) | 2.1 mg | 13% | 1.69 mg |
| Vitamin B6 | 0.06 mg | 4% | 0.05 mg |
| Folate (DFE) | 148 mcg | 37% | 119 mcg |
| Vitamin B12 | 0 mcg | 0% | 0 mcg |
| Choline | 7.9 mg | 1% | 6.4 mg |
| Minerals | |||
| Calcium | 8.7 mg | 1% | 7 mg |
| Iron | 1.6 mg | 9% | 1.28 mg |
| Potassium | 55 mg | 1% | 44 mg |
| Magnesium | 22 mg | 5% | 18 mg |
| Phosphorus | 72 mg | 6% | 58 mg |
| Zinc | 0.63 mg | 6% | 0.51 mg |
| Copper | 0.12 mg | 14% | 0.1 mg |
| Manganese | 0.4 mg | 17% | 0.32 mg |
| Selenium | 33 mcg | 60% | 26.4 mcg |
| Other | |||
| Water | 77 g | 62.1 g | |
| Caffeine | 0 mg | 0 mg | |
| Alcohol | 0 g | 0 g | |
* Percent Daily Values are based on a 2,000 calorie diet (FDA reference values for adults and children 4 years and older). Per-100 g values are USDA figures before label rounding.
Every serving below is a USDA household measure for this food, a fraction of one, or a unit conversion. Amounts are USDA values scaled by weight; only the Nutrition Facts panel applies the coarser FDA label rounding.
| Serving | Weight | Calories | Total carbohydrate | Protein | Total fat | Dietary fiber | Total sugars |
|---|---|---|---|---|---|---|---|
| 1 cup spaghetti not packed | 124 g | 196 | 38.3 g | 7.2 g | 1.2 g | 2.2 g | 0.7 g |
| 1 cup spaghetti packed | 151 g | 239 | 46.6 g | 8.8 g | 1.4 g | 2.7 g | 0.8 g |
| 1 cup elbows not packed | 120 g | 190 | 37 g | 7 g | 1.1 g | 2.2 g | 0.7 g |
| 1 cup elbows packed | 132 g | 209 | 40.7 g | 7.7 g | 1.2 g | 2.4 g | 0.7 g |
| 1 cup penne | 107 g | 169 | 33 g | 6.2 g | 1 g | 1.9 g | 0.6 g |
| 1 cup farfalle | 107 g | 169 | 33 g | 6.2 g | 1 g | 1.9 g | 0.6 g |
| 1 cup rotini | 107 g | 169 | 33 g | 6.2 g | 1 g | 1.9 g | 0.6 g |
| 1 cup shells | 105 g | 166 | 32.4 g | 6.1 g | 1 g | 1.9 g | 0.6 g |
| 1 cup lasagne | 116 g | 183 | 35.8 g | 6.7 g | 1.1 g | 2.1 g | 0.6 g |
| 100 g | 100 g | 158 | 30.9 g | 5.8 g | 0.9 g | 1.8 g | 0.6 g |
A cup of cooked spaghetti (124 g) has 196 calories. 100 g has 158 calories. On a Nutrition Facts label, calories are rounded to the nearest 5 or 10, so the panel above may show 200.
A cup of cooked spaghetti (124 g) has 38.3 g total carbohydrate, including 2.2 g dietary fiber and 0.7 g total sugars. Carbohydrate minus fiber is 36 g.
A cup of cooked spaghetti (124 g) has 7.2 g protein, 14% of the 50 g Daily Value. 100 g has 5.8 g. At 10 to 19% DV per serving, that meets the FDA threshold for a "good source" claim.
A cup of cooked spaghetti (124 g) has 148 mcg of folate, 37% of the Daily Value. 100 g has 119 mcg. At 20% DV or more per serving, that meets the FDA threshold for an "excellent source" claim.
A cup of cooked spaghetti (124 g) has 1.6 mg of iron, 9% of the Daily Value. 100 g has 1.28 mg. That is below the 10% DV a serving needs for a "good source" claim.
100 g of pasta has 158 calories, 5.8 g protein, 30.9 g carbohydrate, 1.8 g fiber, 0.56 g sugars and 0.93 g fat.
About 80% of the calories in pasta come from carbohydrate, 5% from fat and 15% from protein (Atwater factors of 4, 9 and 4 calories per gram).
Dry pasta absorbs water as it boils and more than doubles in weight. The calories do not change, they are just spread over more grams, so 100 g of dry pasta has more than twice the calories of 100 g of cooked pasta, which has 158. The Nutrition Facts panel on a box of pasta describes the dry product, while this page describes cooked pasta, which is why the two rarely match gram for gram.
Salting the cooking water adds sodium. This record is for pasta cooked without salt, and USDA's record for pasta cooked in salted water has many times the sodium of this one's 1 mg per 100 g.
All dried wheat pasta shapes share the same per-gram nutrition. What changes is how much pasta fits in a cup, because shapes pack differently. USDA's cooked cup weights:
Because a cup is so loose a measure for pasta, weighing cooked pasta gives a more reliable number.
Most dry pasta in the US is made from durum wheat semolina and water. "Enriched" pasta has thiamin, riboflavin, niacin, folic acid and iron added to the levels set by the FDA standard for enriched macaroni products. That folic acid is why a cup of cooked pasta has 148 mcg of folate. Whole wheat pasta keeps the bran and germ and has more fiber, but it is often not enriched. Fresh egg pasta from the refrigerated case is made with eggs, so it has some cholesterol and different values.
Most food makers weigh pasta dry, because that is how it is bought and portioned. If you do, enter the dry weight using a dry pasta record, then set the serving from the finished dish, since the water the pasta absorbs adds weight but no calories. If you weigh cooked pasta, use this cooked record. Mixing the two, such as a cooked weight entered against a dry record, puts the calories off by a factor of two or more. Build the recipe in the label generator or the recipe nutrition calculator, and check the reference amount for your product in the RACC lookup.
The same serving of pasta, drawn by the label formats other markets require: the Canadian bilingual Nutrition Facts table, the EU nutrition declaration (per 100 g, energy in kJ and kcal, salt instead of sodium) and the UK nutrition information table with reference intakes. The generator switches between these and many more from one recipe.
| Fat / Lipides | 1.2 g | 2 % |
| Saturated / Saturés | 0.2 g + Trans 0 g | 1 % |
| Cholesterol / Cholestérol | 0 mg | 0 % |
| Sodium | 0 mg | 0 % |
| Carbohydrate / Glucides | 38 g | 14 % |
| Fibre / Fibres | 2 g | 8 % |
| Sugars / Sucres | 1 g | 1 % |
| Protein / Protéines | 7 g | |
| Vitamin D / Vitamine D | 0 mcg | 0 % |
| Calcium | 9 mg | 1 % |
| Iron / Fer | 2 mg | 9 % |
| Potassium | 55 mg | 2 % |
| Per 100g | |
|---|---|
| Energy | 661 kJ / 158 kcal |
| Fat | 0.9 g |
| of which saturates | 0.2 g |
| Carbohydrate | 31 g |
| of which sugars | 0.6 g |
| Protein | 5.8 g |
| Salt | 0.0 g |
| Per 100g | Per 124g | %RI* | |
|---|---|---|---|
| Energy | 661 kJ 158 kcal |
820 kJ 196 kcal |
9.8% |
| Fat | 0.9g | 1.2g | 1.6% |
| of which saturates | 0.2g | 0.2g | 1.1% |
| Carbohydrate | 31g | 38g | 15% |
| of which sugars | 0.6g | 0.7g | <1% |
| Fibre | 1.8g | 2.2g | - |
| Protein | 5.8g | 7.2g | 14% |
| Salt | 0 gg | 0 gg | <1% |
Different forms of the same food are separate USDA records, so each has its own page. Per 100 g:
| Form | Calories | Protein | Total fat | Total carbohydrate |
|---|---|---|---|---|
| PastaPasta, cooked, enriched, without added salt | 158 | 5.8 g | 0.93 g | 30.9 g |
| Dry PastaPasta, dry, enriched | 371 | 13 g | 1.51 g | 74.7 g |
If you make and sell a product that contains pasta, these free tools cover the next steps.
Nutrient values are from USDA FoodData Central, SR Legacy (April 2018 release, public domain), record 169737: "Pasta, cooked, enriched, without added salt". Values are stored per 100 g exactly as USDA reports them and scaled to each serving by weight. The Nutrition Facts panel applies the FDA rounding rules in 21 CFR 101.9; tables and text show the scaled amounts at reading precision, so a figure can differ slightly from the panel. A nutrient USDA does not report for this food is shown as not reported, never as a guessed value.
SR Legacy predates the added sugars field. This is a whole or unsweetened food, so added sugars are shown as 0 g. View the USDA record ↗