Protein in Meat and Fish: Chart per 3 oz Cooked
Protein, calories and fat in 41 cooked meats, poultry, fish and shellfish per 3 oz and per 100 g, from USDA data, with protein per calorie compared.
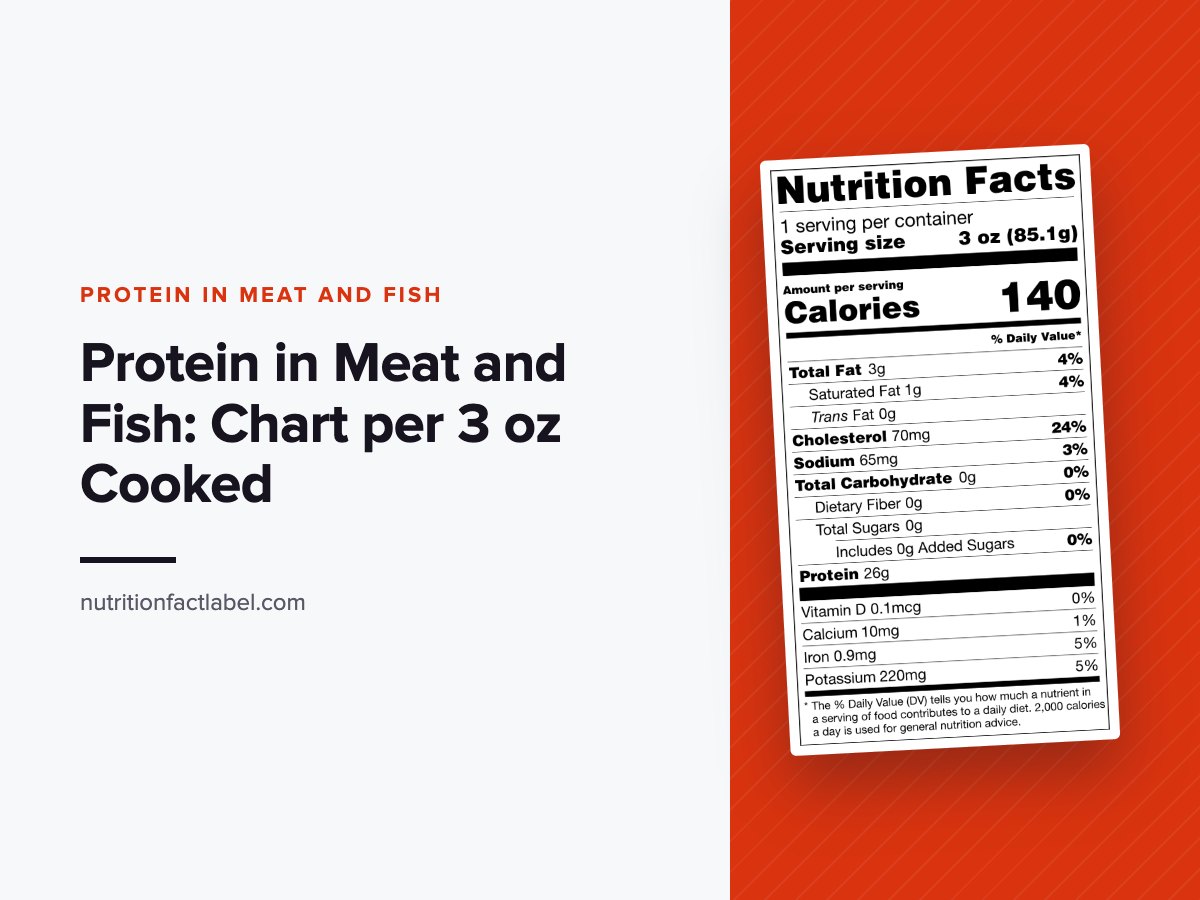
A 3 oz (85 g) serving of cooked meat, poultry or fish has about 15 to 27 g of protein in USDA FoodData Central. Roasted chicken breast has 26.4 g per 3 oz, 90% lean ground beef 21.4 g, farmed Atlantic salmon 18.8 g and cooked shrimp 19.4 g.
The charts below cover 41 cooked meats, poultry, fish and shellfish, grouped by type and sorted by protein per 3 oz. Every value is for the cooked food, as eaten, without bone or shell (canned sardines include their soft bones). Each food links to its full nutrition page, where you can change the serving and see the Nutrition Facts label.
Highest-protein meats and fish per 3 oz
Per 3 oz cooked, the top five in this chart are chicken breast (26.4 g), filet mignon (25.9 g), venison (25.7 g), ahi tuna (24.8 g), turkey (24.7 g). Shellfish and fattier fish sit at the lower end, blue crab at 15.2 g and farmed catfish at 15.7 g.
Protein in poultry
| Food (cooked) | Protein per 3 oz | Calories per 3 oz | Fat per 3 oz | Protein per 100 g |
|---|---|---|---|---|
| Chicken Breast | 26.4 g | 140 | 3 g | 31 g |
| Turkey | 24.7 g | 135 | 3.3 g | 29.1 g |
| Ground Turkey | 23.3 g | 173 | 8.8 g | 27.4 g |
| Chicken Thigh | 21 g | 152 | 6.9 g | 24.8 g |
| Chicken Wing | 20.2 g | 216 | 14.3 g | 23.8 g |
| Chicken Drumstick | 19.8 g | 162 | 8.6 g | 23.4 g |
| Ground Chicken | 19.8 g | 161 | 9.3 g | 23.3 g |
| Duck | 16.1 g | 286 | 24.1 g | 19 g |
Protein in beef and game
| Food (cooked) | Protein per 3 oz | Calories per 3 oz | Fat per 3 oz | Protein per 100 g |
|---|---|---|---|---|
| Filet Mignon | 25.9 g | 179 | 7.6 g | 30.5 g |
| Venison | 25.7 g | 134 | 2.7 g | 30.2 g |
| Bison | 24.2 g | 122 | 2.1 g | 28.4 g |
| Flank Steak | 23.5 g | 163 | 7 g | 27.7 g |
| Beef Liver | 22.5 g | 149 | 4 g | 26.5 g |
| Sirloin Steak | 22.1 g | 206 | 12.8 g | 26 g |
| 90% Lean Ground Beef | 21.4 g | 173 | 9.1 g | 25.2 g |
| Ground Beef | 20.9 g | 197 | 11.9 g | 24.6 g |
| 80% Lean Ground Beef | 20.4 g | 209 | 13.5 g | 24 g |
| Ribeye Steak | 20.1 g | 247 | 18.5 g | 23.7 g |
Protein in pork and lamb
| Food (cooked) | Protein per 3 oz | Calories per 3 oz | Fat per 3 oz | Protein per 100 g |
|---|---|---|---|---|
| Pork Tenderloin | 22.2 g | 122 | 3 g | 26.2 g |
| Ground Pork | 21.8 g | 252 | 17.7 g | 25.7 g |
| Pork Chop | 21.8 g | 178 | 9.4 g | 25.6 g |
| Ground Lamb | 21 g | 241 | 16.7 g | 24.8 g |
| Lamb | 20.8 g | 250 | 17.8 g | 24.5 g |
| Ham | 19.2 g | 151 | 7.7 g | 22.6 g |
Protein in fish
| Food (cooked) | Protein per 3 oz | Calories per 3 oz | Fat per 3 oz | Protein per 100 g |
|---|---|---|---|---|
| Ahi Tuna | 24.8 g | 111 | 0.5 g | 29.2 g |
| Tilapia | 22.2 g | 109 | 2.3 g | 26.2 g |
| Canned Tuna | 21.7 g | 99 | 0.7 g | 25.5 g |
| Wild Atlantic Salmon | 21.6 g | 155 | 6.9 g | 25.4 g |
| Sardines | 20.9 g | 177 | 9.7 g | 24.6 g |
| Trout | 20.2 g | 143 | 6.3 g | 23.8 g |
| Mahi Mahi | 20.2 g | 93 | 0.8 g | 23.7 g |
| Albacore Tuna | 20.1 g | 109 | 2.5 g | 23.6 g |
| Canned Salmon | 19.6 g | 117 | 4.3 g | 23.1 g |
| Cod | 19.4 g | 89 | 0.7 g | 22.8 g |
| Halibut | 19.2 g | 94 | 1.4 g | 22.5 g |
| Atlantic Salmon | 18.8 g | 175 | 10.5 g | 22.1 g |
| Catfish | 15.7 g | 122 | 6.1 g | 18.4 g |
Protein in shellfish
| Food (cooked) | Protein per 3 oz | Calories per 3 oz | Fat per 3 oz | Protein per 100 g |
|---|---|---|---|---|
| Shrimp | 19.4 g | 101 | 1.4 g | 22.8 g |
| Scallops | 17.5 g | 94 | 0.7 g | 20.5 g |
| Lobster | 16.2 g | 76 | 0.7 g | 19 g |
| Blue Crab | 15.2 g | 71 | 0.6 g | 17.9 g |
Protein per calorie
Fat changes calories much more than it changes protein. Per 100 calories, ahi tuna has 22.4 g, canned tuna has 22 g, mahi mahi has 21.8 g, cod has 21.7 g, while 80% lean ground beef has 9.8 g and roasted duck with skin 5.6 g. Compare 85% lean and 90% lean ground beef: protein per 3 oz differs by under 1 g, calories by 24.
Raw weight or cooked weight
Meat loses water as it cooks, so the same piece weighs less and has more protein per gram afterward. That is why these cooked values are higher than the raw ones: about 4 oz of raw boneless chicken breast cooks down to roughly 3 oz. When you total a recipe, use raw weights with raw records or cooked weights with cooked records, never a mix. The chicken breast page links to its other forms, such as boiled and with skin.
Protein on a Nutrition Facts label
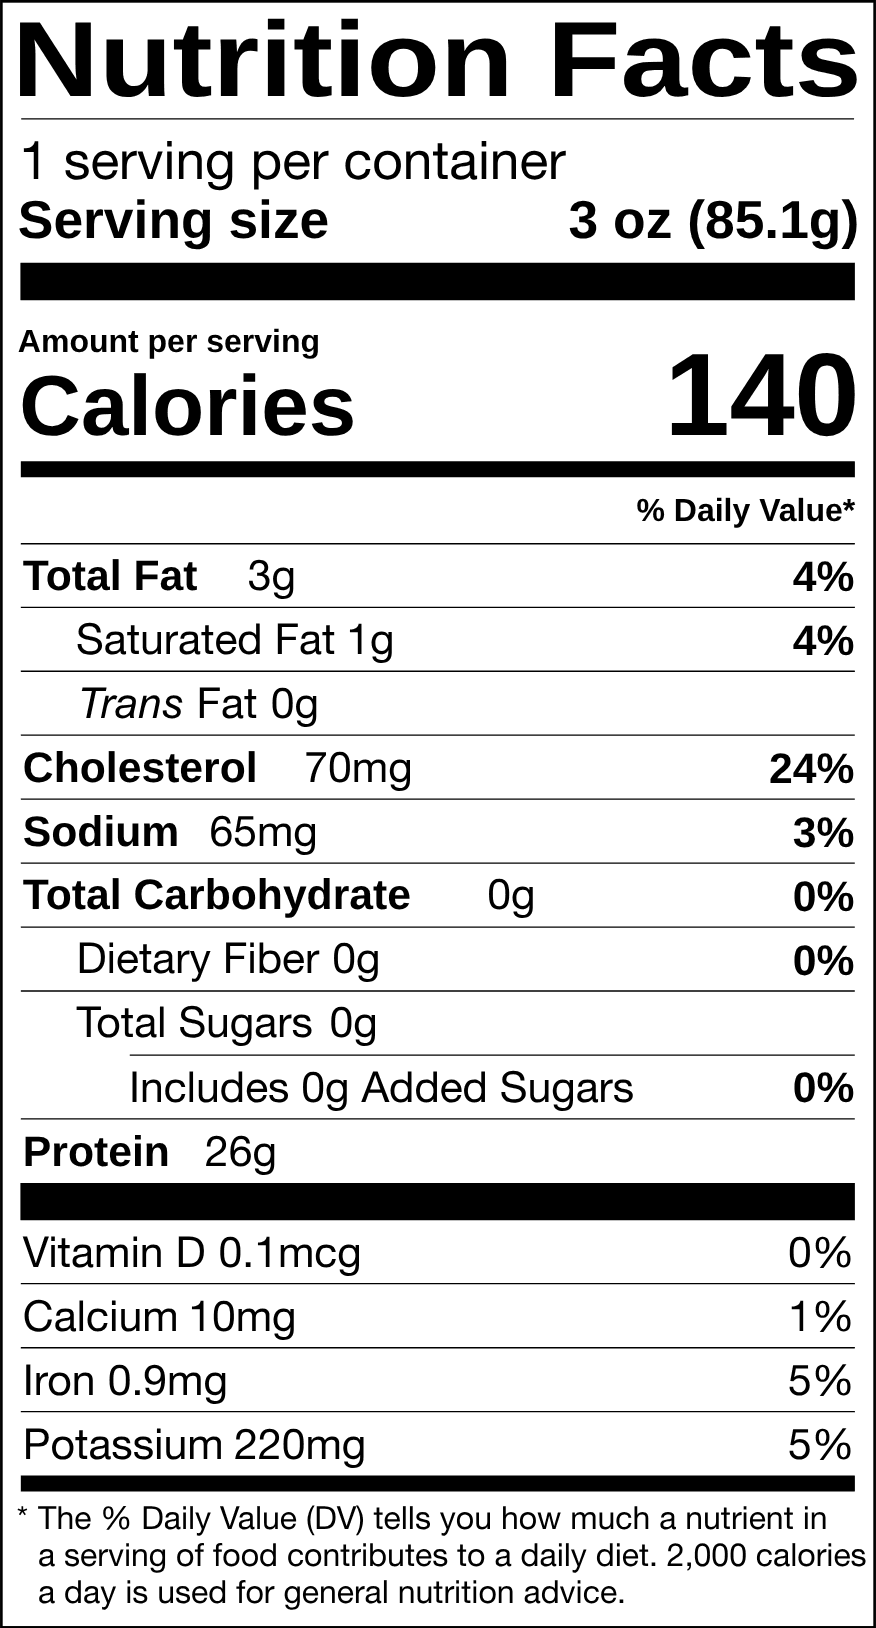
On a US label, grams of protein are always listed. The %DV for protein is optional unless the package makes a protein claim or the food is for children under 4; when it is shown, it must be corrected for protein quality. Meat and poultry products are labeled under USDA FSIS rules, while fish and seafood fall under FDA rules. To label a product that contains meat or fish, total the recipe in the recipe nutrition calculator and build the panel with the nutrition facts label generator.
Source and method
All values come from USDA FoodData Central, SR Legacy (April 2018), cooked records as named on each linked food page. Per 3 oz values use 85 g and are calculated from the per-100 g values, then rounded to 0.1 g (protein, fat) or 1 calorie. Canned fish values are drained solids.