Dairy Nutrition Chart: Milk, Yogurt, Cheese, Cream
Calories, protein, fat and calcium in 26 dairy foods per cup, container, ounce and tablespoon, from USDA data, with sour cream and its swaps compared.

A cup of whole milk has 149 calories and 7.7 g of protein in USDA FoodData Central; a cup of skim milk has 83 calories and about the same protein. A tablespoon of sour cream has 24 calories, and a tablespoon of butter 102.
The charts below compare 26 dairy foods in the serving people actually use: milk by the cup, yogurt by the 6 oz container, cheese by the ounce, and cream, sour cream and butter by the tablespoon. Each food links to its full nutrition page, where you can change the serving and see the Nutrition Facts label.
Milk: whole, 2%, 1% and skim
Milk fat is the only big difference between the grades. Per cup, whole milk has 7.9 g of fat, 2% milk 4.8 g, 1% milk 2.4 g and skim 0.2 g, while protein stays near 8 g. The percentage is fat by weight, not by calories: 2% milk gets about 36% of its calories from fat.
| Food (per 1 cup) | Calories | Protein | Fat | Saturated fat | Calcium |
|---|---|---|---|---|---|
| Skim Milk | 83 | 8.3 g | 0.2 g | 0.1 g | 299 mg |
| Buttermilk | 98 | 8.1 g | 2.6 g | 1.6 g | 284 mg |
| 1% Milk | 102 | 8.2 g | 2.4 g | 1.5 g | 305 mg |
| 2% Milk | 122 | 8.1 g | 4.8 g | 3.1 g | 293 mg |
| Kefir | 127 | 8.8 g | 2.3 g | 1.5 g | 303 mg |
| Whole Milk | 149 | 7.7 g | 7.9 g | 4.6 g | 276 mg |
Yogurt and cottage cheese
Straining is what makes Greek yogurt different: more whey is drained off, so per 6 oz it has 15.3 g of protein against 5.9 g for regular plain yogurt. Nonfat Greek yogurt has the most protein per calorie in this chart, 17.3 g per 100 calories.
| Food (per 6 oz (170 g)) | Calories | Protein | Fat | Saturated fat | Calcium |
|---|---|---|---|---|---|
| Nonfat Greek Yogurt | 100 | 17.3 g | 0.7 g | 0.2 g | 187 mg |
| Plain Yogurt | 104 | 5.9 g | 5.5 g | 3.6 g | 206 mg |
| Greek Yogurt | 165 | 15.3 g | 8.5 g | 4.1 g | 170 mg |
| Cottage Cheese | 167 | 18.9 g | 7.3 g | 2.9 g | 141 mg |
Cheese per ounce
Hard, aged cheeses lose water as they age, which concentrates everything else. Per ounce, Parmesan has 10.1 g of protein and 336 mg of calcium, while fresh ricotta has 2.1 g and 43 calories.
| Food (per 1 oz (28 g)) | Calories | Protein | Fat | Saturated fat | Calcium |
|---|---|---|---|---|---|
| Ricotta Cheese | 43 | 2.1 g | 2.9 g | 1.8 g | 58 mg |
| Feta Cheese | 75 | 4 g | 6.1 g | 3.8 g | 140 mg |
| Mozzarella | 85 | 6.3 g | 6.3 g | 3.9 g | 143 mg |
| American Cheese | 104 | 5.1 g | 8.7 g | 5.1 g | 296 mg |
| Parmesan Cheese | 111 | 10.1 g | 7.1 g | 4.2 g | 336 mg |
| Swiss Cheese | 111 | 7.6 g | 8.8 g | 5.2 g | 252 mg |
| Cheddar Cheese | 116 | 6.9 g | 9.6 g | 5.5 g | 202 mg |
Cream, sour cream and butter
Per 100 g, regular sour cream has 198 calories, light sour cream 136 and fat-free sour cream 74. Lower-fat versions replace some fat with milk solids and thickeners, so their carbohydrate goes up as the fat comes down. Plain whole-milk Greek yogurt, at 97 calories per 100 g, is the usual swap for sour cream.
| Food (per 1 tbsp) | Calories | Protein | Fat | Saturated fat | Calcium |
|---|---|---|---|---|---|
| Whipped Cream | 8 | 0.1 g | 0.7 g | 0.4 g | 3 mg |
| Fat Free Sour Cream | 9 | 0.4 g | 0 g | 0 g | 15 mg |
| Light Sour Cream | 16 | 0.4 g | 1.3 g | 0.8 g | 17 mg |
| Half and Half | 20 | 0.5 g | 1.7 g | 1.1 g | 16 mg |
| Reduced Fat Sour Cream | 22 | 0.8 g | 1.7 g | 1 g | 17 mg |
| Sour Cream | 24 | 0.3 g | 2.3 g | 1.2 g | 12 mg |
| Cream Cheese | 51 | 0.9 g | 5 g | 2.9 g | 14 mg |
| Heavy Whipping Cream | 51 | 0.4 g | 5.4 g | 3.5 g | 10 mg |
| Butter | 102 | 0.1 g | 11.5 g | 7.3 g | 3 mg |
Dairy on a Nutrition Facts label
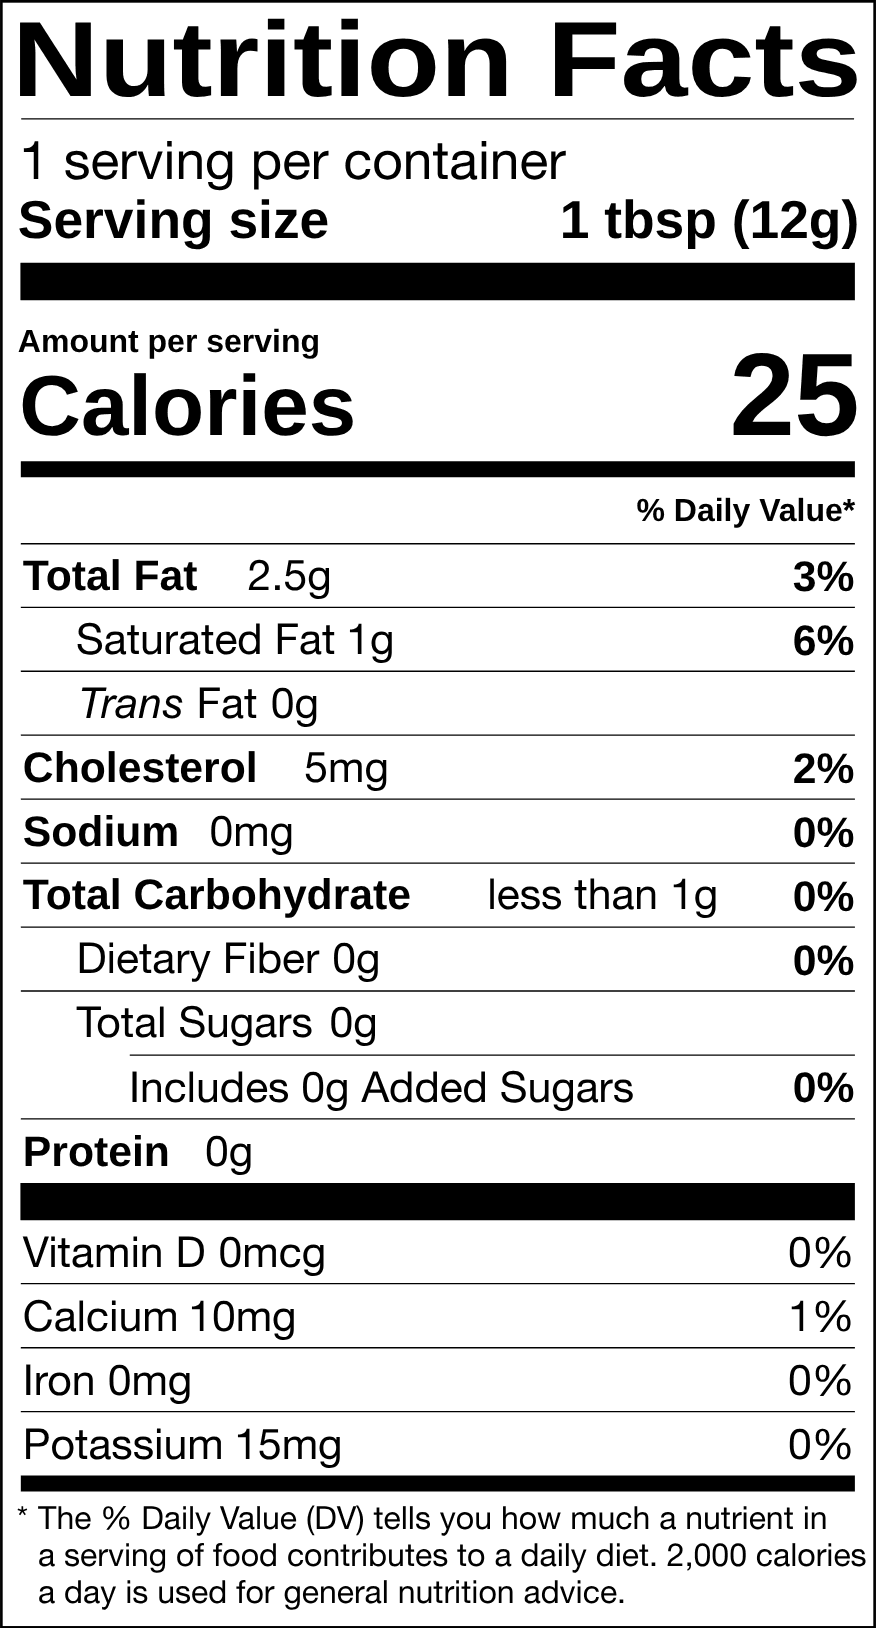
Calcium is one of the four vitamins and minerals every US Nutrition Facts label must show, so it appears on every dairy panel, in milligrams and %DV. Any product containing milk, butter, cream, cheese, yogurt or whey must also declare milk as a major food allergen. To label a recipe that uses dairy, total it in the recipe nutrition calculator and build the panel with the nutrition facts label generator. For meat, see the beef cuts nutrition chart.
Source and method
All values come from USDA FoodData Central, SR Legacy (April 2018), records as named on each linked food page. Values per serving are calculated from the per-100 g values using the gram weight of each serving (1 cup of milk 244 to 245 g, 1 tbsp of sour cream 12 g, 1 tbsp of butter 14.2 g), then rounded to 0.1 g or 1 calorie and 1 mg. n/a means USDA reports no value for that nutrient.


