How many calories are in fried chicken skin?
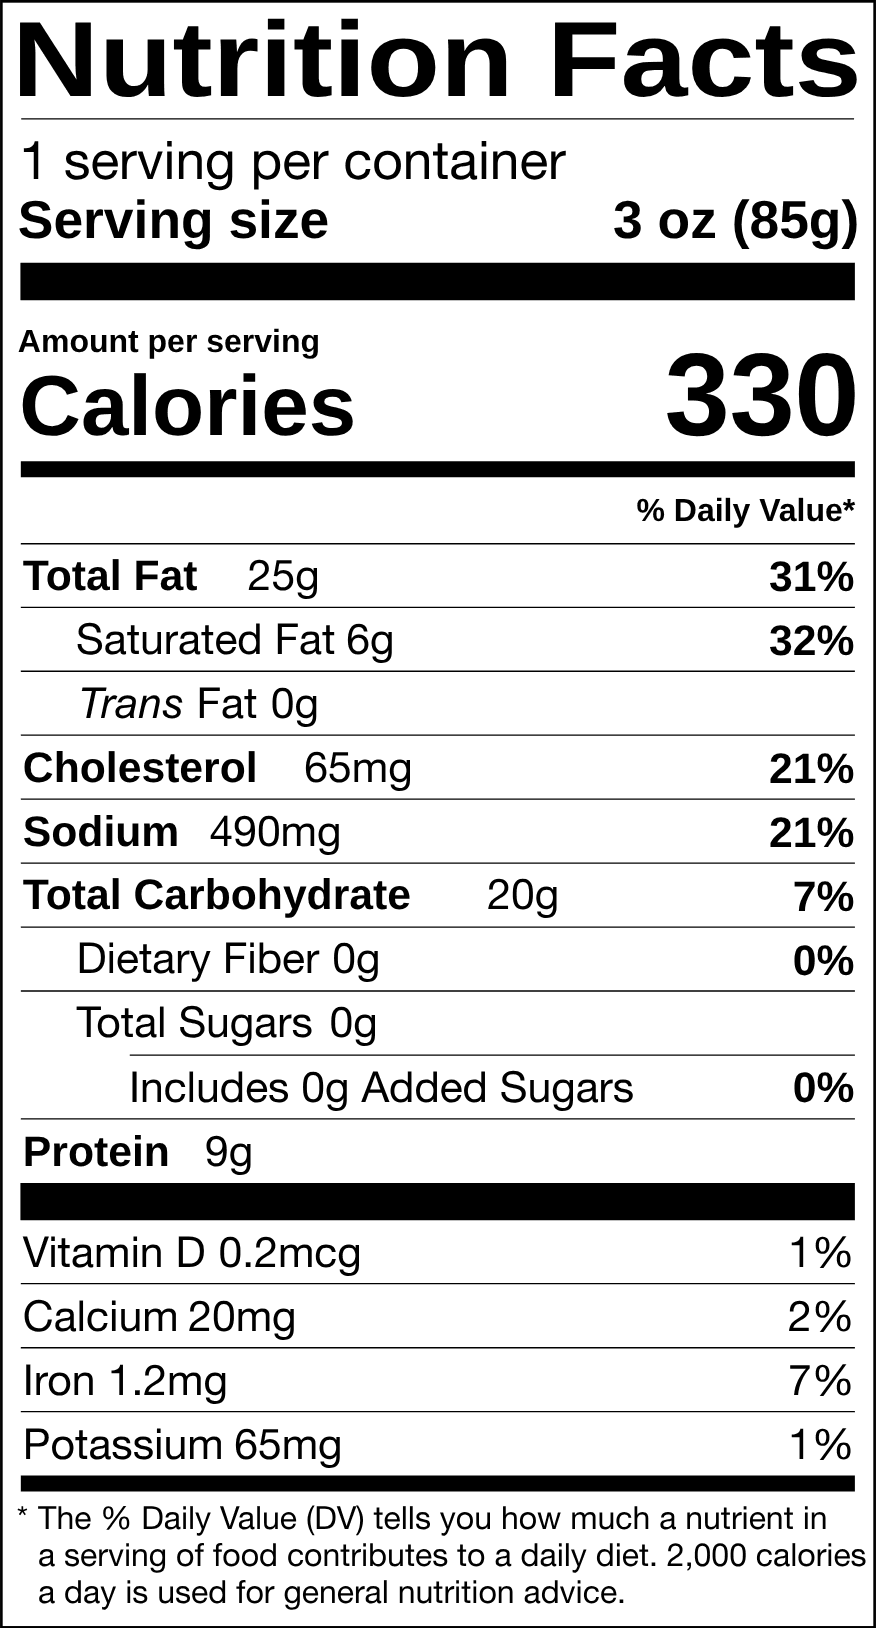
Fried chicken skin (3 oz, 85 g) has 335 calories. 100 g has 394 calories. On a Nutrition Facts label, calories are rounded to the nearest 5 or 10, so the panel above may show 330.
Fried Chicken Skin nutrition facts from USDA FoodData Central: 335 calories in 3 oz, with 8.8 g protein, 19.7 g carbohydrate and 24.5 g fat. Change the serving below and the label, the summary and the full nutrient table update together.
FDA standard format. Values use the FDA rounding rules for the serving you pick. Nutrients USDA does not report for this food print as 0 on the panel and as "not reported" in the table.
Download this label: · PNG Free to use as a reference. A label for a product you sell needs your full recipe and ingredient statement.
3 oz (85 g)
Opens the free label generator with this amount of fried chicken skin already added. Add the rest of your ingredients and the label updates as you go.
| Nutrient | Per serving | % DV* | Per 100 g |
|---|---|---|---|
| Calories and macronutrients | |||
| Calories | 335 | 394 | |
| Total fat | 24.5 g | 31% | 28.8 g |
| Saturated fat | 6.5 g | 32% | 7.61 g |
| Trans fat | not reported | ||
| Monounsaturated fat | 10.5 g | 12.4 g | |
| Polyunsaturated fat | 5.8 g | 6.83 g | |
| Cholesterol | 63 mg | 21% | 74 mg |
| Sodium | 494 mg | 21% | 581 mg |
| Total carbohydrate | 19.7 g | 7% | 23.2 g |
| Dietary fiber | not reported | ||
| Total sugars | not reported | ||
| Added sugars | not reported | ||
| Protein | 8.8 g | 10.3 g | |
| Vitamins | |||
| Vitamin D | 0.17 mcg | 1% | 0.2 mcg |
| Vitamin A | not reported | ||
| Vitamin C | 0 mg | 0% | 0 mg |
| Vitamin E | not reported | ||
| Vitamin K | not reported | ||
| Thiamin (B1) | 0.15 mg | 12% | 0.17 mg |
| Riboflavin (B2) | 0.15 mg | 12% | 0.18 mg |
| Niacin (B3) | 2.8 mg | 18% | 3.34 mg |
| Vitamin B6 | 0.05 mg | 3% | 0.06 mg |
| Folate (DFE) | 53 mcg | 13% | 62 mcg |
| Vitamin B12 | 0.14 mcg | 6% | 0.17 mcg |
| Choline | not reported | ||
| Minerals | |||
| Calcium | 22 mg | 2% | 26 mg |
| Iron | 1.2 mg | 7% | 1.43 mg |
| Potassium | 64 mg | 1% | 75 mg |
| Magnesium | 10 mg | 2% | 12 mg |
| Phosphorus | 68 mg | 5% | 80 mg |
| Zinc | 0.61 mg | 6% | 0.72 mg |
| Copper | 0.06 mg | 7% | 0.07 mg |
| Manganese | 0.09 mg | 4% | 0.11 mg |
| Selenium | 46 mcg | 83% | 53.9 mcg |
| Other | |||
| Water | 30.7 g | 36.1 g | |
* Percent Daily Values are based on a 2,000 calorie diet (FDA reference values for adults and children 4 years and older). Per-100 g values are USDA figures before label rounding.
Every serving below is a USDA household measure for this food, a fraction of one, or a unit conversion. Amounts are USDA values scaled by weight; only the Nutrition Facts panel applies the coarser FDA label rounding.
| Serving | Weight | Calories | Total carbohydrate | Protein | Total fat | Dietary fiber | Total sugars |
|---|---|---|---|---|---|---|---|
| 3 oz | 85 g | 335 | 19.7 g | 8.8 g | 24.5 g | – | – |
| 1/2 unit (yield from 1 lb ready-to-cook chicken) | 114 g | 449 | 26.4 g | 11.8 g | 32.9 g | – | – |
| 1 chicken, skin only | 190 g | 749 | 44 g | 19.6 g | 54.8 g | – | – |
| 100 g | 100 g | 394 | 23.2 g | 10.3 g | 28.8 g | – | – |
Fried chicken skin (3 oz, 85 g) has 335 calories. 100 g has 394 calories. On a Nutrition Facts label, calories are rounded to the nearest 5 or 10, so the panel above may show 330.
Fried chicken skin (3 oz, 85 g) has 46 mcg of selenium, 83% of the Daily Value. 100 g has 53.9 mcg. At 20% DV or more per serving, that meets the FDA threshold for an "excellent source" claim.
Fried chicken skin (3 oz, 85 g) has 6.5 g of saturated fat, 32% of the Daily Value. 100 g has 7.61 g. That is 20% DV or more per serving, which the FDA treats as high.
100 g of fried chicken skin has 394 calories, 10.3 g protein, 23.2 g carbohydrate and 28.8 g fat.
About 24% of the calories in fried chicken skin come from carbohydrate, 66% from fat and 10% from protein (Atwater factors of 4, 9 and 4 calories per gram).
The same serving of fried chicken skin, drawn by the label formats other markets require: the Canadian bilingual Nutrition Facts table, the EU nutrition declaration (per 100 g, energy in kJ and kcal, salt instead of sodium) and the UK nutrition information table with reference intakes. The generator switches between these and many more from one recipe.
| Fat / Lipides | 25 g | 33 % |
| Saturated / Saturés | 6 g + Trans 0 g | 32 % |
| Cholesterol / Cholestérol | 63 mg | 21 % |
| Sodium | 490 mg | 21 % |
| Carbohydrate / Glucides | 20 g | 7 % |
| Fibre / Fibres | 0 g | 0 % |
| Sugars / Sucres | 0 g | 0 % |
| Protein / Protéines | 9 g | |
| Vitamin D / Vitamine D | 0 mcg | 1 % |
| Calcium | 22 mg | 2 % |
| Iron / Fer | 1 mg | 7 % |
| Potassium | 64 mg | 2 % |
| Per 100g | |
|---|---|
| Energy | 1648 kJ / 394 kcal |
| Fat | 29 g |
| of which saturates | 7.6 g |
| Carbohydrate | 23 g |
| of which sugars | 0.0 g |
| Protein | 10 g |
| Salt | 1.5 g |
| Per 100g | Per 85g | %RI* | |
|---|---|---|---|
| Energy | 1648 kJ 394 kcal |
1401 kJ 335 kcal |
17% |
| Fat | 29g | 25g | 35% |
| of which saturates | 7.6g | 6.5g | 32% |
| Carbohydrate | 23g | 20g | 7.6% |
| of which sugars | 0 gg | 0 gg | <1% |
| Fibre | 0 gg | 0 gg | - |
| Protein | 10g | 8.8g | 18% |
| Salt | 1.5g | 1.2g | 21% |
Different forms of the same food are separate USDA records, so each has its own page. Per 100 g:
| Form | Calories | Protein | Total fat | Total carbohydrate |
|---|---|---|---|---|
| Fried Chicken SkinChicken, broilers or fryers, skin only, cooked, fried, batter | 394 | 10.3 g | 28.8 g | 23.2 g |
| Chicken SkinChicken, broilers or fryers, skin only, cooked, roasted | 454 | 20.4 g | 40.7 g | 0 g |
If you make and sell a product that contains fried chicken skin, these free tools cover the next steps.
Nutrient values are from USDA FoodData Central, SR Legacy (April 2018 release, public domain), record 171453: "Chicken, broilers or fryers, skin only, cooked, fried, batter". Values are stored per 100 g exactly as USDA reports them and scaled to each serving by weight. The Nutrition Facts panel applies the FDA rounding rules in 21 CFR 101.9; tables and text show the scaled amounts at reading precision, so a figure can differ slightly from the panel. A nutrient USDA does not report for this food is shown as not reported, never as a guessed value.
SR Legacy predates the added sugars field, and this processed food may contain some, so added sugars are shown as not reported. The label panel prints 0 g because a row cannot be blank; a real product label needs the figure from its recipe. View the USDA record ↗